|
|
| Menu location |
|---|
| Results → post pipeline from result |
| Workbenches |
| FEM |
| Default shortcut |
| None |
| Introduced in version |
| - |
| See also |
| FEM tutorial |
Description
Descripción
Pipeline es un objeto de resultado, que crea una nueva representación gráfica de los resultados del análisis FEM en la parte analizada. Añade escala de colores y más opciones de visualización.
introduced in 1.1: The results pipeline can store results from multiple frames. To switch between the different frames, select them from the list.
Usage
Cómo usar
- Necesita un objeto de resultado válido en
 Analysis container, como CalculiX_static_results.
 - Seleccione el objeto de resultado
- Haga clic en el botón
 , o haga clic en el menú Results y el elemento Post Pipeline from results. Se agregará un nuevo objeto llamado "Pipeline" a su documento; note si aparecerá fuera del contenedor de análisis.
 - Haga doble clic en el nuevo objeto Pipeline en el árbol Modelo y seleccione el tipo de propiedades para mostrar. Las configuraciones típicas son: Modo: Seleccione Superficie, Campo: Es decir. Von Mises stress
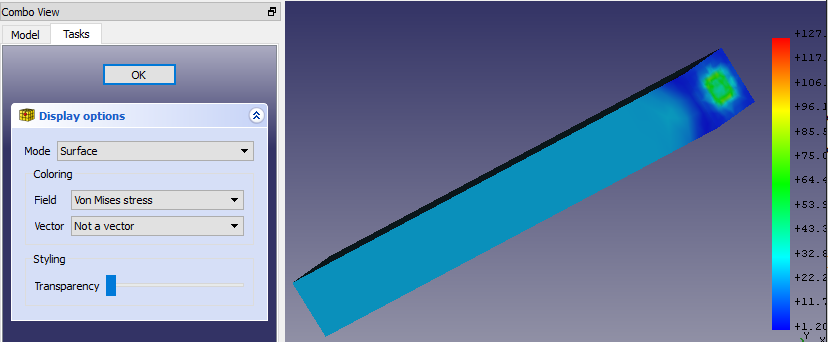
- Modo: Cómo dibujar los resultados.
- Campo: Qué propiedad del resultado dibujar.
- Vector: Si una propiedad es un vector, puede restringir los datos a un eje (X, Y, Z) o seleccionar Magnitud para usar el valor del vector.
- Si no ve ningún modelo en el área gráfica, vaya a Edit → Preferences, seleccione la categoría Display y marque una casilla {{KEY|Enable backlight color} }
- Si hace doble clic en la escala, puede modificar las propiedades de visualización.
- Degradado: puede seleccionar el orden inverso del degradado de color predeterminado o Negro-Blanco o Blanco-Negro.
- Rango de parámetros: los valores mínimo y máximo se completan automáticamente, cuando selecciona una propiedad para evaluar en el objeto Pipeline; Puedes modificarlos, pero asegúrate de saber lo que estás haciendo. También puede modificar el número de etiquetas mostradas y el número de decimales que se mostrarán.
If you see no model in the graphical area, go to and enable Edit → Preferences → Display → 3D View → Rendering → Backlight color.
If you use a SI-derived FreeCAD unit system, the values in the output scale are based on SI units as well. This means the displacement is in meter, the stress is in Pascal and the temperature is in Kelvin.
Data and extractions
introduced in 1.1: In the Data and extractions section, available also in the task panels of pipeline filters, multiple tools for simulation result data processing are available.
- The Data Summary button displays a table with min and max values of all output variables while the Show Data button displays a table with values of all output variables for all nodes. Thus, the table can be very large.
- The Export to CSV button makes it possible to export the table to .csv file for external use.
- The Copy selection to clipboard button (shortcut Ctrl+C) can be used to copy the table to clipboard.
- The New button allows adding new data objects to the Data and extractions tab based on FieldData (results from all nodes) or IndexOverFrames (results from node with a selected number):
- New Lineplot - creates XY plot
- with FieldData - X- and Y-axis can be configured to show any output variables, results are taken from all nodes
- with IndexOverFrames - Y-axis can be configured to show any output variable, X-axis shows time/frequency (based on the frames), results are taken only from a node with a specified index (number)
- New Histogram - creates histogram plot
- with FieldData - uses selected output variable and results from all nodes
- with IndexOverFrames - uses selected output variable and results from a node with a specified index (number)
- New Table - creates a table
- with FieldData - lists values of a selected output variable for all nodes
- with IndexOverFrames - lists values of a selected output variable for a node with a specified index (number) in each frame
- New Lineplot - creates XY plot
- The Add data to button adds data from the current filter to the selected existing data extraction object
Properties
Dialog box
This pipeline dialog box has the following settings:
- Mode: How to draw the results. The possible modes are
- Outline: The outline of the result mesh. In fact, it displays no results but only the borders of the mesh.
- Nodes: The result mesh nodes.
- Surface: This is the default and displays the surface of the result mesh.
- Surface with Edges: Like Surface but with the mesh outline edges and the surface mesh node connection lines.
- Field: Which result property to draw.
- Vector: Is only active if the Field is a vector. You can select whether to display the vector Magnitude or its X, Y, Z components.
Scale
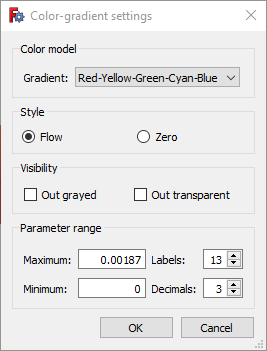
If you double-click on the scale, you get this settings dialog box:
and you can modify these properties:
- Gradient: You can select reversed order of the default color gradient, Red-White-Blue, Black-White or White-Black.
- Style: The default option Flow uses the full color gradient range. The option Zero uses only the color gradient range starting from the color that would display the mean value to the maximum.
- Visibility: The option Out grayed will color all mesh nodes whose values are outside the set minimum/maximum range in gray. The option Out transparent will make these mesh nodes transparent.
- Parameter range: Minimum and maximum values are filled-in automatically. You can modify them, however make sure you know what you are doing. You can also change the number of displayed decimal places and the number of labels distributed over the parameter range.
Property Editor
In the Property View you can set in the View tab the settings from the dialog box. In the Data tab you can additionally set this:
- DatosMode: How the filters used in the pipeline will be treated. These modes are possible:
- Serial: In this mode every filter takes the previous filter as input. The order is hereby the order of creation. The first created filter takes the pipeline as input. Its Input property is therefore empty.
- Parallel: In this mode all filters take the pipeline as input.
- Custom: This is the default and keeps the input of the filters as they are. Therefore it allows to have e.g. two filters that take the pipeline as input, and a third filter that takes one of the two filters as input.
Scripting
introduced in 1.2: The addArrayFromFunction function can be used to create custom arrays based on the pipeline fields. For example, send the pipeline to the Python Console and use the following command to obtain a temperature field in Celsius degrees instead of Kelvins:
obj.addArrayFromFunction({"temp_C": "Temperature - 273"})
Esta página ha sido recuperada de https://wiki.freecad.org/FEM_PostPipelineFromResult